- What is the yield curve?
- What does it mean when it’s reversed?
- What is Yield Curve Control (YCC)?
- And how does the Eurodollar fit into all of this?
Inspirational Tweet:
As Lyn Alden explains in this thread: “…the 10-2 curve says, “we are probably approaching a possible, but not confirmed, recession, and probably several months away…‘”
Let’s break this down a bit, shall we?
What is the yield curve?
First, what exactly is the yield curve everyone seems to be talking about lately, and how does it relate to inflation, the Federal Reserve, and a possible recession?
The yield curve is basically a graph plotting all the current nominal rates (not including inflation) of every bond issued by the government. Maturity is the term of an obligation, and yield is the annual interest rate a bond will pay the buyer.
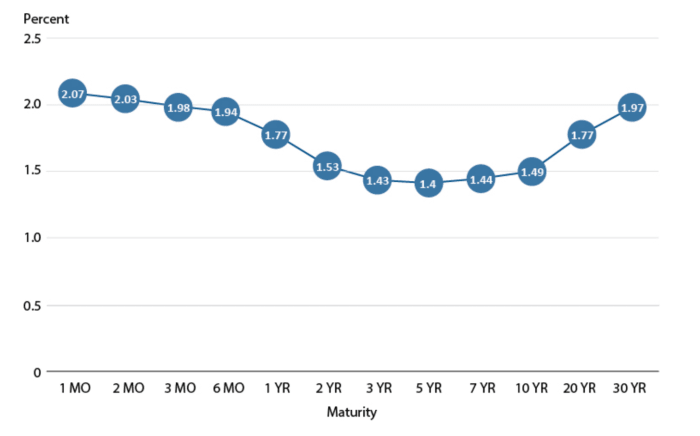
A normal yield curve chart (from 2018) will generally look like this:
The Fed sets what’s called the Federal Funds Rate, and it’s the shortest interest rate you can get a quote on, because it’s the (annualized) rate the Fed suggests to commercial banks to borrow and lend their excess reserves overnight. This rate is the reference from which all other rates are established (or almost, in theory).
As you can see, in a normal economic environment, the shorter the maturity of the bond, the lower the yield. This makes perfect sense as the shorter the time spent lending someone money, the less interest you will charge them for that agreed lock-up period (duration). So how does this tell us anything about future economic downturns or possible recessions?
It’s there that yield curve inversion comes into play and what we’re going to get into next.
What does it mean when reversed?
When shorter-term bonds, like 3 months or 2 years, start to reflect a higher yield than longer-term bonds, 10 years or even 30 years, then we know there are problems the horizon. Basically, the market is telling you that investors expect rates to go down in the future due to an economic downturn or recession.
So when we see something like this (e.g. August 2019):
SOURCE: FRED®, Federal Reserve Bank of St. Louis
…where 3-month and 2-year bonds yield more than 10-year bonds, investors are starting to get nervous.
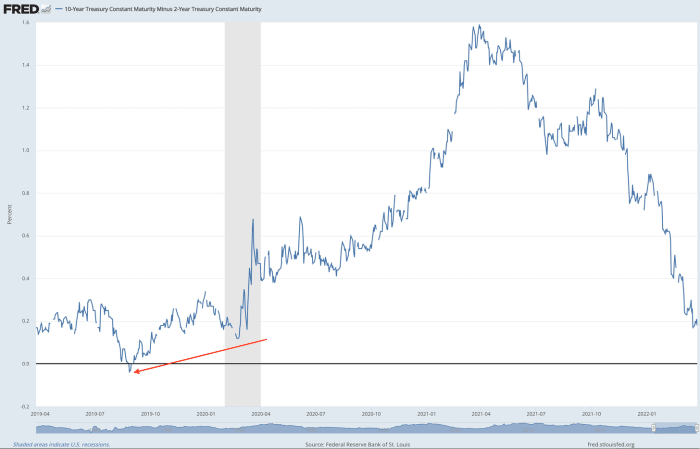
You will also see it sometimes expressed as below, showing the actual spread between 2-year and 10-year interest rates. Notice the momentary reversal in August 2019 here:
SOURCE: FRED®, Federal Reserve Bank of St. Louis
Why is it so important, if it’s just a indication and not yet a reality?
Because the reversal not only shows an expected slowdown, but can actually wreak havoc on the lending markets themselves and cause problems for businesses as well as consumers.
When short-term rates are higher than long-term rates, consumers who have variable rate mortgages, home equity lines of credit, personal loans and credit card debt will see their payments increase due to rising short-term rates.
Also, profit margins fall for companies that borrow at short-term rates and lend at long-term rates, like many banks. This collapse in spreads causes a sharp drop in profits for them. They are therefore less willing to lend at a narrow spread, which only perpetuates borrowing problems for many consumers.
It’s a painful feedback loop for all.
What is yield curve control?
No surprise, the Fed has an answer to all of this – isn’t it always the case? In the form of what we call yield curve control (YCC). It’s basically the Fed setting a target level for rates and then entering the open market and purchase short-term paper (generally 1 month to 2 year bonds) and/or sale long-term paper (10 to 30 year bonds).
Buying lowers short-term bond interest rates and selling drives higher long-term bond interest rates, normalizing the curve toward a “healthier” state.
Of course, there is a cost to all of this with the likely expansion of the Fed’s balance sheet and continued expansion of the money supply, especially when the free market does not participate to the level necessary for the Fed to reach its target rates.
Results? Possible exacerbated inflation, even in the face of a shrinking economy. That’s what we call stagflation. Unless controlling the curve helps avert an impending recession and economic expansion resumes: a big if.
What is the Eurodollar and how does it fit into all of this?
A Eurodollar bond is a bond denominated in US dollars issued by a foreign company and held in a foreign bank outside both the United States and the country of origin of the issuer. A little confusing, because the prefix “euro” is a general reference to all foreign companies and banks, not just European ones.
More importantly, and in our context here, the Eurodollar futures contracts are forward contracts on interest rates on the eurodollar, with a duration of three months.
To put it simply, these futures contracts will trade at whatever the market waits US 3 month interest rate levels will be in the future. They are an additional data point and indicator of when the market expects interest rates to peak. (This is also known as terminal rate of the Fed cycle.)
For example, if the December 2023 Eurodollar contract shows an implied rate of 2.3% and rates fall to 2.1% in the March 2024 contract, then the expected peak in the fed funds rate would be at the end of 2023 or early 2024.
Simple as that, and just another place to look for clues as to what investors are thinking and expecting.
What You Can Do About It… (Yes — Bitcoin)
Let’s say you’re watching rates closely and hear that the Fed is going to start using YCC to manage the yield curve, thereby printing more money and, in turn, likely causing longer-term inflation. What if inflation got out of hand? How can you protect yourself?
It doesn’t matter when you read this, as long as the world still runs primarily on fiat currency (government-issued and “backed”), bitcoin remains an inflation hedge and an insurance against hyperinflation. I wrote a simple but in-depth thread about it here:
Identifying Bitcoin inflation hedging attributes is very simple. Because bitcoin is governed by a mathematical formula (not a board, CEO, or founder), the supply of bitcoin is absolutely limited to 21 million in total.
Additionally, with a truly decentralized network (the computers that collectively govern the bitcoin algorithm, mining, and settlements of transactions), the transactions settled and the total number of bitcoins to be minted will never change. Bitcoin is therefore immutable.
In other words, Bitcoin is safe.
Whether or not the price of bitcoin (BTC) is volatile in the short term doesn’t matter as much as whether we know the value of the US dollar continues to fall. And over the long term and in total, as the dollar goes down, BTC appreciates. So it’s a long-term inflation hedge of not just the US dollar, but any government-issued fiat currency.
The best part? Each bitcoin is made up of 100 million “pence” (in fact, the smallest unit of bitcoin – 0.00000001 btc – is called satoshis, or sats), and so one can buy as much or as little as one can or we want in a single transaction.
$5 or $500 million: You name it, Bitcoin can handle it.
This is a guest post by James Lavish. The opinions expressed are entirely their own and do not necessarily reflect those of BTC Inc or Bitcoin Magazine.